
The average Cheshire East home reached a record £309,121 in July, up 5.0% in a year. Semis rose fastest, flats barely moved, and June was revised down.
The average home in Cheshire East was worth £309,121 in July. That is the highest figure the borough has recorded.
The average rose £14,773 in a year, an annual increase of 5.0%. The previous peak was £303,960 in November 2025. (UK House Price Index, Cheshire East)
Prices rose 2.1% in July alone, from £302,865 in June. That is the borough’s biggest one-month rise since May 2024. HM Land Registry published the figures on 16 September.
The index is a mean average, not a median, and it covers the whole borough. Wilmslow and Alderley Edge sit in the same figure as Crewe and Nantwich. It shows the direction of travel, not the price of a particular house in Macclesfield.
Semis and terraces are still rising fastest
| Property type | Average price, July 2026 | Change in a year |
|---|---|---|
| Detached | £501,839 | +4.6% |
| Semi-detached | £296,274 | +5.9% |
| Terraced | £228,419 | +5.7% |
| Flat | £155,474 | +1.7% |
| First-time buyer average | £250,343 | +5.4% |
The pattern is the same as in June. Semis and terraces, the homes most first-time buyers look at, are climbing faster than detached houses. Flats have barely moved in a year.
Detached homes crossed the £500,000 mark for the first time in this release.
How the borough compares
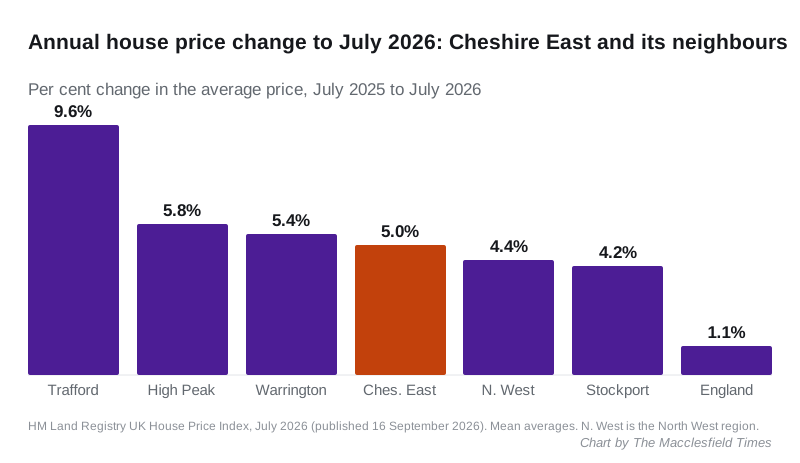
Cheshire East is growing more than four times as fast as England, where the average rose 1.1% to £293,479. It is also ahead of the North West, up 4.4% to £221,445.
Cheshire East ranks 39th of the 295 English local authority districts for annual growth, up from 66th last month. It is 144th on price. Eighty-five districts recorded a fall over the year.
Among the neighbours, it sits in the middle:
| Area | Average price | Change in a year |
|---|---|---|
| Trafford | £400,688 | +9.6% |
| Derbyshire Dales | £355,387 | +7.1% |
| Staffordshire Moorlands | £224,415 | +7.1% |
| Newcastle-under-Lyme | £209,112 | +6.6% |
| High Peak | £258,856 | +5.8% |
| Cheshire West and Chester | £270,104 | +5.8% |
| Warrington | £260,040 | +5.4% |
| Cheshire East | £309,121 | +5.0% |
| Stockport | £317,913 | +4.2% |
| Manchester | £252,309 | +1.2% |
Trafford’s average passed £400,000. Stockport, which borders Poynton, is still the dearer borough, but it is rising more slowly.
June has been revised down
The Land Registry keeps adding completed sales to a month after it first publishes it, so each new release restates the last one.
June was first published as £303,387, up 5.0%. It now stands at £302,865, up 4.8%. That is £522 off the average. It is a smaller revision than May’s, which lost £2,139 last month.
July’s figure will be restated the same way in the next release, so treat £309,121 as provisional.
Sales are still well down on last year
Sales counts run about two months behind prices. The latest complete month is May 2026, when 361 homes sold in Cheshire East, against 573 in May 2025. That is a fall of 37%.
The earlier months have been revised up slightly since last month’s release:
- January 2026: 375 sales, against 529 in January 2025
- February: 407, against 590
- March: 443, against 1,114
- April: 361, against 332
- May: 361, against 573
March 2025 was inflated by buyers completing before the stamp duty threshold changed on 1 April 2025, and April 2025 was the dip that followed. Leave those two months aside and the rest tell the same story: about a third fewer homes are changing hands than a year ago.
What it means for you
Buying: the cheaper houses are the ones pulling away. Semis and terraces are up by nearly 6% in a year, and the first-time buyer average is now £250,343. Flats, up 1.7%, are the one type that has barely moved.
Selling: a record average does not mean a quick sale. Volumes are down by about a third, so there are fewer buyers as well as fewer rival sellers. The average only reflects homes that actually sold.
Checking a figure you have been quoted: agents often quote a town-level or rolling-year average. This index is a monthly mean for the whole borough. Both can be right and still differ.
For the town-level picture, see our Macclesfield house prices page. Last month’s figures are in our June report.
Have your say