
The average Cheshire East home reached £303,387 in June, a 5% annual rise. Terraces and semis climbed fastest, and 31% fewer homes sold in early 2026.
The average home in Cheshire East was worth £303,387 in June, £14,494 more than a year earlier, according to the UK House Price Index published on 19 August.
That is an annual rise of 5.0%, the fastest rate in the borough since November 2025, and it comes after a flat winter. In March the annual change had fallen to 0.3%. It has climbed every month since. (UK House Price Index, Cheshire East)
One thing to be clear about before the numbers: the index is a mean average, not a median, and it covers the whole borough. Wilmslow and Alderley Edge sit in the same figure as Crewe and Nantwich, so it describes the direction of travel rather than the price of a house in Macclesfield.
Cheaper homes are rising fastest
The gap between property types is the most useful part of this month’s release.
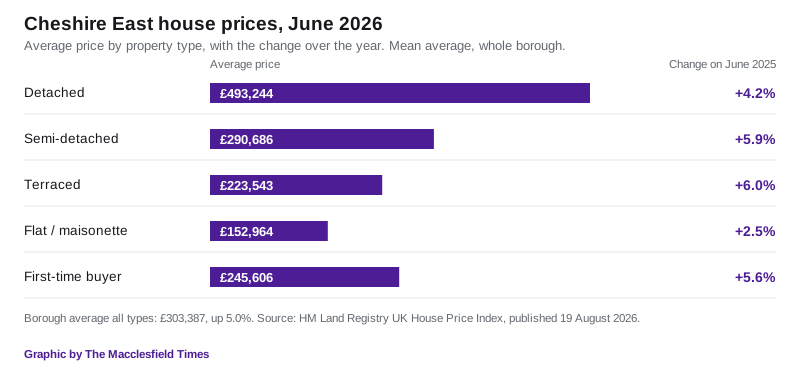
Terraced houses rose 6.0% to £223,543 and semi-detached 5.9% to £290,686. Detached homes, the most expensive at £493,244, rose more slowly at 4.2%. Flats barely moved, up 2.5% to £152,964.
The first-time buyer average was £245,606, up 5.6% on the year. In other words the parts of the market that first-time buyers actually shop in are the parts getting more expensive fastest.
How the borough compares
Cheshire East ranks 66th of the 295 English local authority districts for annual price growth in June, and 147th on price level, which puts it mid-table for cost and in the top quarter for the rate of increase. Sixty-two districts recorded a fall over the year. Cheshire East was not one of them.
Set against the wider picture, the borough is running well ahead of the country and slightly behind its region: England averaged £293,262 and 1.8% growth, the North West £219,922 and 4.7%.
Among the neighbours, though, Cheshire East is in the middle of the pack:
| Area | Average price | Annual change |
|---|---|---|
| Derbyshire Dales | £353,364 | +11.7% |
| Trafford | £396,811 | +9.7% |
| Staffordshire Moorlands | £227,875 | +9.4% |
| Cheshire West and Chester | £269,039 | +6.9% |
| Newcastle-under-Lyme | £209,547 | +6.6% |
| Warrington | £259,398 | +6.5% |
| High Peak | £252,980 | +5.8% |
| Cheshire East | £303,387 | +5.0% |
| Stockport | £314,495 | +3.5% |
| Manchester | £251,250 | +2.9% |
Derbyshire Dales, just over the hill from Macclesfield, had the third fastest rise in England. Stockport, the borough most Macclesfield and Poynton commuters travel into, is growing at little more than half Cheshire East’s rate, and remains the more expensive of the two.
Far fewer homes are selling
Prices are one half of the story. Transactions are the other, and they are down sharply.
The index publishes sales volumes about three months behind the price, so the most recent reliable count is April 2026, when 333 homes sold in Cheshire East. The comparable months tell the story:
- January: 370 sales, against 529 in January 2025
- February: 399, against 590
- March: 412, against 1,114
- April: 333, against 332
March is the outlier, and it is not a market collapse. The 1,114 sales in March 2025 were a rush to complete before the stamp duty threshold changed on 1 April 2025, and the 332 recorded that April is the hangover.
Compare the months the stamp duty change did not distort and the picture is clearer. January and February 2026 produced 769 sales between them against 1,119 in the same two months of 2025, a fall of 31%. April 2026 was level with April 2025, but April 2025 was itself the depressed month.
Last month’s figure has been revised down
The Land Registry keeps adding completed sales to a month after it first publishes it, so early figures are provisional and they move.
May 2026 for Cheshire East was first published as £302,367, an annual rise of 3.5%. In this month’s release it has been restated as £300,228, a rise of 2.8%. That is £2,139 off the average and 0.7 percentage points off the annual rate. Our own Macclesfield house prices page has been updated to the revised figure.
What actually changed hands
Land Registry price paid records for June show sales across the area ranging from a flat on Mill Road in Macclesfield at £75,000 to a detached house on Woodside Lane in Poynton at £900,000. A semi-detached house on Fence Avenue in Macclesfield sold for £799,000, and a detached house on Trouthall Lane in Knutsford for £750,000. At the other end, a terraced house on King Edward Street in Macclesfield went for £102,500 and a flat on Chapel Street for £80,000.
Price paid data is added to for months after a sale, so June is not yet complete and these are a snapshot rather than the full picture. (HM Land Registry price paid data)
What it means for you
If you are buying, the squeeze is at the cheaper end. Terraces and semis are rising at nearly 6% while detached homes rise at 4.2% and flats at 2.5%, so the ladder’s bottom rungs are the ones moving away fastest. A flat is the one part of this market that has barely moved in a year.
If you are selling, thin volumes matter more than the headline. About 31% fewer homes changed hands in January and February than in the same months last year, which means fewer competing sellers but also fewer buyers, and a longer wait. The rising average reflects what did sell, not what sat on the market.
If you are comparing quotes or figures, check which average you are being shown. Agents often quote a rolling-year average for one town; this index is a monthly mean for the whole borough. They are different numbers measuring different things, and both are correct.
The July 2026 index is due at 9.30am on 16 September 2026. It will restate June, so treat this month’s figure as provisional too.
For the town-level picture, and the gap between Macclesfield and the villages on the Wilmslow side, see our Macclesfield house prices page.
Have your say