
The average Cheshire East home was £311,652 in September, £94 below August's revised record. Prices are up 4.0% in a year, against 0.8% across England.
The average home in Cheshire East was worth £311,652 in September. That is just £94 below August’s figure of £311,746, which is now the highest the borough has recorded.
The figures come from the UK House Price Index for September 2026, which HM Land Registry published on 18 November. The borough’s series is on the Land Registry’s open data browser.
Over the year, prices rose £11,947, or 4.0%, from £299,705 in September 2025. Across England the rise was 0.8%, so Cheshire East is climbing five times as fast.
The index is a mean average, not a median, and it covers the whole borough. Wilmslow and Alderley Edge sit in the same figure as Crewe and Nantwich. It shows the direction of travel, not the price of a particular house in Macclesfield.
Six months of rises, then a pause
Prices bottomed out at £291,245 in February. They then rose for six months in a row, gaining £20,501 by August. September’s figure was flat on the month.
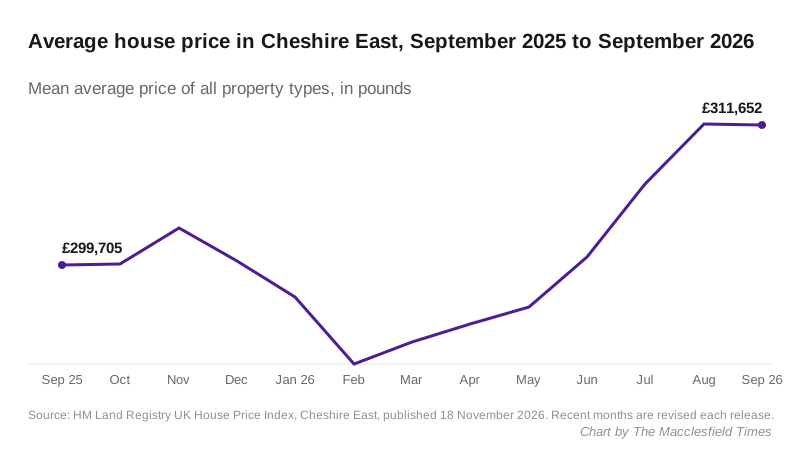
Recent months move when the Land Registry adds late-registered sales. When we reported July’s figures in September, July’s average was a record £309,121. It has since been revised down to £306,576. September’s figure may be revised in the same way.
The annual growth rate has eased slightly, from 4.4% in August to 4.0% in September.
Semis are still rising fastest
| Property type | Average, September 2026 | Change in a year |
|---|---|---|
| Detached | £506,014 | +3.8% |
| Semi-detached | £298,844 | +4.8% |
| Terraced | £230,160 | +4.3% |
| Flat or maisonette | £156,607 | +1.0% |
First-time buyers paid an average of £252,501, up 4.4% on a year. People moving on from a home they owned paid £373,428, up 3.8%.
Buyers using a mortgage paid an average of £317,419. Cash buyers paid £300,059.
How the borough compares
Cheshire East is rising faster than the North West as a whole, where the average is £220,477, up 3.2%. England’s average is £292,998.
| Area | Average price | Change in a year |
|---|---|---|
| High Peak | £263,821 | +5.5% |
| Stockport | £321,895 | +5.2% |
| Trafford | £394,017 | +4.7% |
| Cheshire East | £311,652 | +4.0% |
| Cheshire West and Chester | £271,627 | +3.3% |
| Staffordshire Moorlands | £224,116 | +2.9% |
| Warrington | £257,671 | +1.9% |
High Peak, which takes in Glossop, New Mills and Buxton, has overtaken Cheshire East on growth. Stockport, which includes Hazel Grove and Bramhall on Poynton’s border, is now the dearer of the two by £10,243.
What it means for you
A buyer in Cheshire East pays about £18,700 more than the England average, on these mean figures. A first-time buyer’s average has risen by £10,567 in a year, from £241,934.
The town itself runs above the borough figure: the average sold price in Macclesfield is £329,222 on Land Registry sales over the past year.
Sources
- HM Land Registry: UK House Price Index for September 2026 (published 18 November 2026)
- UK House Price Index data, Cheshire East (monthly averages, property types and buyer types; comparison areas from the same index)
Have your say